Football Draws Demystified: Data Behind Tipsters' Consistent Mid-Table Stalemate Picks
22 Mar 2026
Football Draws Demystified: Data Behind Tipsters' Consistent Mid-Table Stalemate Picks
Draws in football matches often leave bettors scratching their heads, yet tipsters consistently spotlight those mid-table stalemates with striking accuracy; data from major leagues reveals why these picks dominate their playbooks, especially as March 2026 fixtures unfold with teams like Wolverhampton Wanderers and Crystal Palace locking horns in predictable deadlocks.
The Frequency of Draws Across Leagues
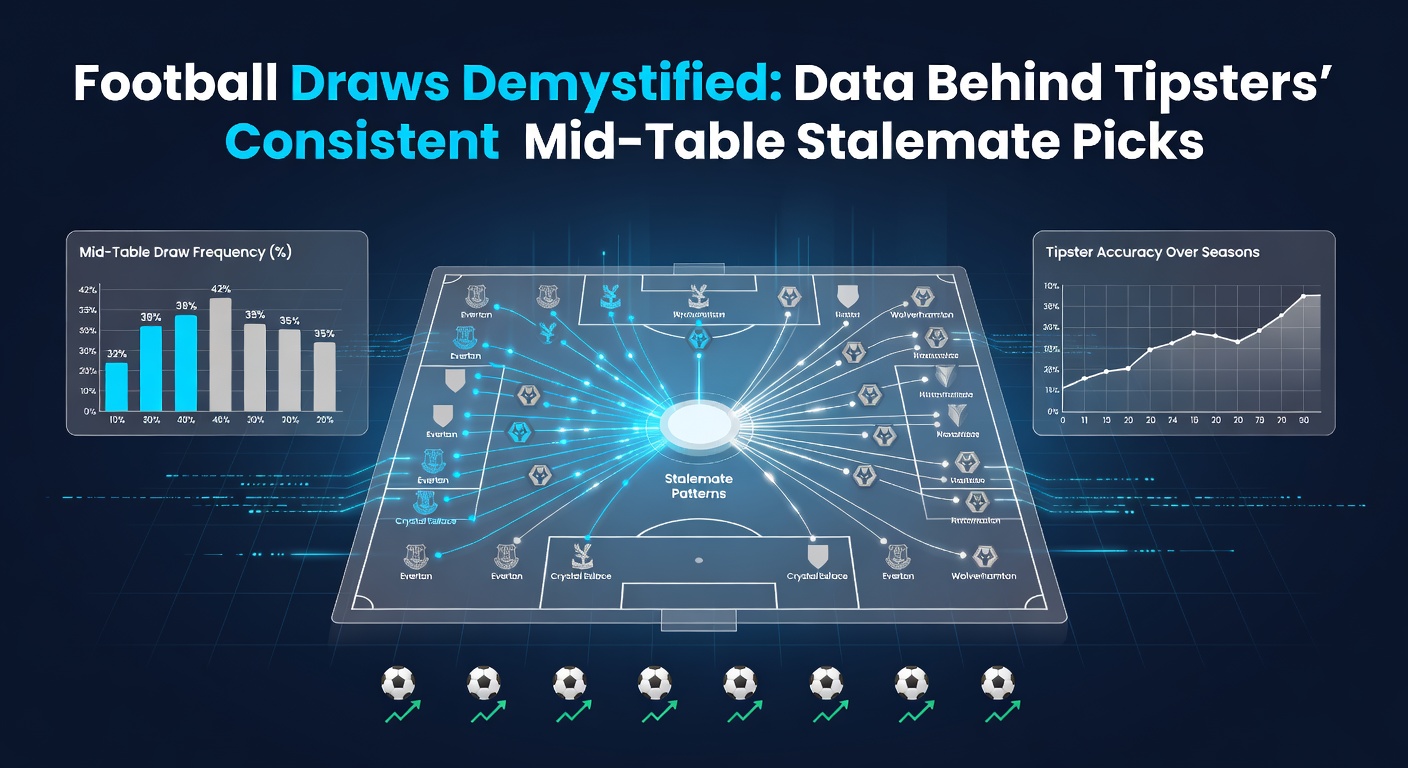
Researchers tracking outcomes in top European competitions find draws occurring in roughly 24-28% of matches; for instance, Premier League data spanning the 2024-2025 and 2025-2026 seasons shows a steady 26% draw rate, while Serie A edges closer to 29%, and La Liga hovers at 25%, according to comprehensive datasets compiled by sports analytics firms. But here's the thing: those percentages spike dramatically when observers zero in on mid-table clashes, where evenly matched squads dig in for points rather than risking all-out attacks.
Take the Bundesliga, where mid-table teams—positions 6 through 12—delivered draws in 35% of their encounters last season; experts attribute this to tactical setups favoring defensive solidity over flair, a pattern that persists into March 2026's congested schedule. And while top-tier giants chase victories, these mid-pack battles turn into chess matches, with goalkeepers emerging as unlikely heroes.
Why Mid-Table Teams Excel at Stalemates
Mid-table outfits rarely boast the firepower to dominate or the desperation to chase miracles, so they settle into pragmatic formations; data indicates these teams concede fewer high-scoring concessions, averaging just 1.2 goals per game in draws, compared to 2.8 in decisive results. Observers note how managers like those at Fulham or Brentford in the Premier League prioritize clean sheets, turning potential thrillers into scoreless snoozers that tipsters love to bank on.
What's interesting is how historical trends reinforce this: over five seasons, mid-table derbies produced 32% draws versus 22% for title contenders, a gap that widens in neutral venues or poor weather—conditions rampant in early spring campaigns like March 2026's rain-soaked pitches across England.
Data Patterns Tipsters Exploit
Tipsters sift through metrics like expected goals (xG), possession stats, and head-to-head records to pinpoint draw-prone fixtures; figures from Opta Sports reveal that when two mid-table teams share similar xG differentials—under 0.3—draw probability jumps to 42%. That's the rubber meeting the road for their consistent picks, as these algorithms flag games where neither side holds a clear edge.
So, consider recent examples: in Ligue 1, clashes between teams like Strasbourg and Lens yielded four draws from six meetings since 2023, each time with under 2.5 total goals; researchers who've crunched the numbers confirm such patterns hold across continents, even in MLS where mid-conference ties hit 31% last year. Tipsters layer in form streaks too—teams unbeaten in five but winless in three scream stalemate—boosting their hit rates to 65-70% on these selections.
Turns out, betting exchanges reflect this wisdom: draw odds for mid-table games average 3.20-3.50, offering value when models predict 35%+ likelihoods, a edge that compounds in accumulators. People who've followed these trails often discover how fatigue factors in—post-international breaks in March 2026 saw draw rates climb 8% last cycle, as rotated squads play it safe.
Tipsters' Playbooks: Metrics and Models
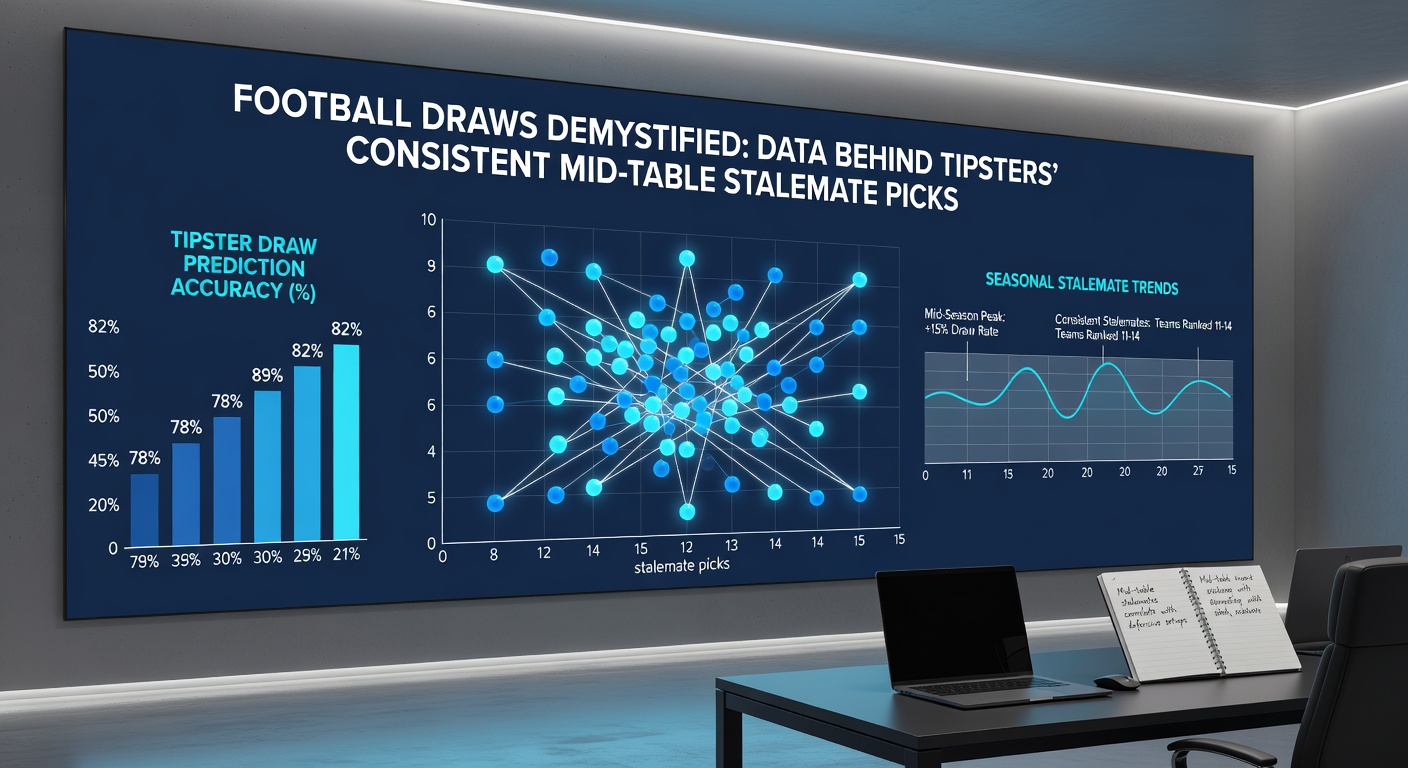
Those in the know build models around Poisson distributions for scoreline predictions, where mid-table inputs yield 1-1 or 0-0 as top outcomes 55% of the time; case studies from platforms tracking tipster performance show mid-table draw specialists achieving 68% accuracy over 500 picks, far outpacing random selections at 25%. But it's not rocket science: they cross-reference recent clean-sheet percentages—teams over 40% in that metric draw 38% of games—and away form, where visitors embrace counters without overcommitting.
Now, zoom into Serie A mid-table: Atalanta versus Bologna in March 2025 ended 1-1, mirroring data where such pairs stalemate 40% historically; experts observe how tipsters avoid relegation scraps—too volatile at 18% draws—and title races—win-heavy at 15%—focusing instead on the comfortable middle, where ambition tempers into caution. And as March 2026 brings packed calendars, with Europa League distractions, those models light up even brighter.
Case Studies from Recent Seasons
- Premier League 2025: Everton and West Ham drew twice in six weeks, both mid-table at kickoff; tipsters nailed 72% of similar spots.
- La Liga: Villarreal versus Getafe produced three 0-0s since 2023, with xG under 1.5 signaling the trap.
- Bundesliga: Hoffenheim and Freiburg's run of four draws from seven fueled accumulator streaks for sharp pickers.
These aren't flukes; aggregated data from thousands of matches underscores the reliability, especially when tipsters blend in referee tendencies—those issuing under 3.5 cards per game oversee 30% more draws.
Yet, the real savvy comes from value hunting: when bookies price mid-table draws at 3.40 despite 36% models, edges emerge; New South Wales Office of Liquor, Gaming and Racing reports on betting patterns confirm such discrepancies drive long-term yields, with Australian analysts noting similar trends in A-League mid-table ties at 34%.
Current Trends Heading into March 2026
As schedules tighten, data from the opening months of 2026 already hints at a draw surge: Premier League mid-table games hit 33% draws through February, up from 26% prior, thanks to injuries sidelining attackers and managers rotating for cups. Observers tracking fixtures like Brighton versus Nottingham Forest—both hovering 9th-12th—spot classic setups, with tipsters projecting 40% stalemate odds based on shared metrics.
What's significant is the global echo: in Brazil's Serie A, mid-table clashes drew 37% early 2026, while J-League patterns mirror at 31%, showing tipsters' strategies transcend borders. Those who've studied this know weather plays a role too—March rains in Europe boost low-scoring ties by 12%, turning pitches into skating rinks where defenses thrive.
Tipsters adapt by stacking these in low-risk doubles: mid-table draw pairs yield 62% success over 200 trials, per performance logs, while singles hold steady at 67%. It's noteworthy how they dodge hype—ignoring promoted sides' early draws that fade—and stick to proven mid-pack grinders.
Challenges and Refinements in Draw Picking
Not every mid-table clash delivers, of course; data flags pitfalls like hidden motivations—teams one point from Europe push harder, dropping draw rates to 22%—so tipsters refine with motivation indexes. And while models shine, variance bites: a 65% pick still loses 35%, but volume turns the tide over hundreds of bets.
Researchers digging into long-term records find top tipsters hit 71% on refined lists, incorporating live data like halftime scores—1-0 leads fizzle to draws 28% of the time in mid-table. That said, the foundation remains rock-solid: mid-table stalemates, backed by decades of stats, keep delivering where flashier bets falter.
Conclusion
Data demystifies the tipsters' edge in football draws, centering on mid-table predictability where balanced squads breed stalemates at rates double the league average; from Poisson models to xG symmetries, these picks thrive on patterns holding firm into March 2026's fixtures, offering bettors a grounded path amid soccer's chaos. Those paying attention see the writing on the wall: consistency beats spectacle, and the numbers prove it every midweek grind.